The interactive drawing shows the north view of the pyramid with the correction to the main chamber roof cavities applied, which you can zoom into to see in more detail. The whole of the roof cavity section is displaced 5 cubits to the east relative to the main chamber and to make the roof stones of the main chamber appear as though they are the same as those in the first cavity their cross section has been re-drawn with the necessary non-vertical sides on the first level.
If you now display the east view , auto start the clock and plot out the secondary master ellipse's equator point vertical projection line you can see how the dynamic plot interacts with the main chamber and its surroundings.
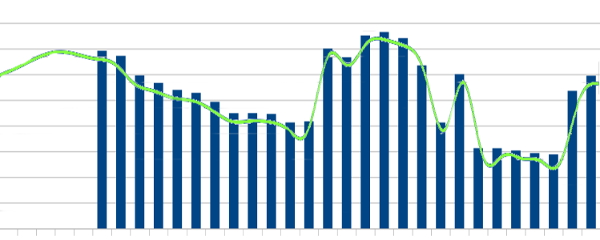
The stones in the roof cavities look very similar to bar graphs, and that is exactly what they are.
As the Earth moves round the Sun in its orbit the vertical projection line moves along the bar graphs and allows you to read out the values of the heights of these stones and relate them to a position in the orbit. To make the readings smooth, the values from the bar graphs need to be mathematically smoothed out and that is why on the left side of these stones the architects have left the east view of the cavity stones visible, which have already been mathematically smoothed. The concept is similar to the functionality of a spread sheet where you can change a graph from bar chart to smoothed lines as shown in the illustration below, which contains the values of the stone's heights from the upper row of stones.

The numerical data that is represented by these stones and graph is the gravitational pull of the other planets in the solar system that is being exerted on the Earth as it moves around its orbit.